Have you heard of heatmaps? They’re an awesome way to get some very useful information about how users interact with your website.
While the word sounds super technical, they are in fact a fairly simple concept.
Webpage heatmaps are very easy to set up and use, making them a no brainer for anyone that wants to improve their revenue, conversion rates and the general user experience.
In this post, we’ll explain what a WordPress heatmap is and how you can use it to implement visitor tracking on your website.
We’ll also walk you through setting up a WordPress heatmap plugin on your site and recommend some other useful plugins you might want to check out.
Let’s get started with heatmaps!
What Are Heatmaps and What Can They Do?
A heatmap sounds complex but it’s actually quite simple. It’s just an image, or map, of your website’s pages that shows where users hover and click. The image below is from Hotjar, a popular heatmap tool.
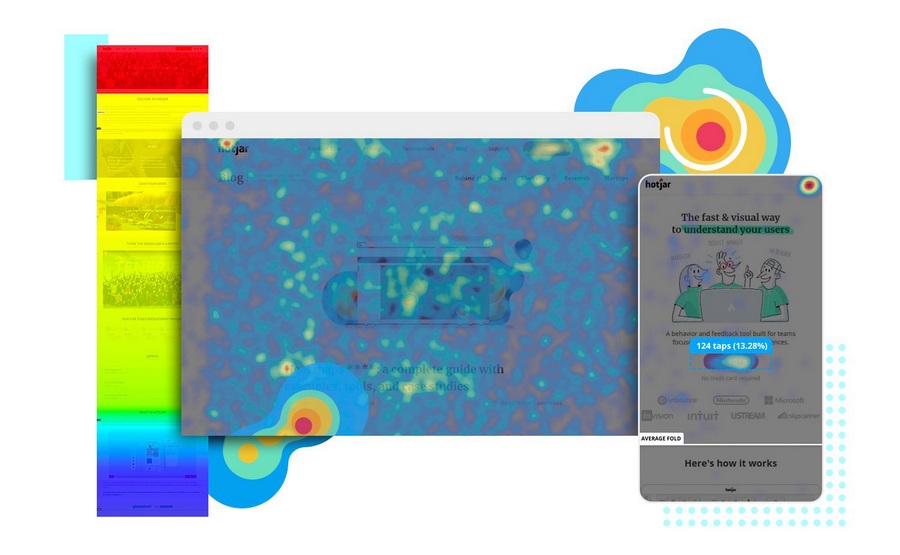
On a heat map like the one above, the areas that users focus on are called “hot”, while the areas they ignore are called “cold.” The term comes from the general concept of a heatmap, which shows areas that are actually hot and cold, temperature-wise.
So, on a website heatmap, the areas that are brighter colors get more interactivity,
Heatmaps are a great way to set up WordPress visitor tracking. They show you exactly which parts of the page attract attention and which parts are ignored by visitors. This makes them super useful for a variety of marketing and design reasons.
What Are the Different Types of Heatmaps?
There are a variety of different heatmap types:
- Scroll maps show the percentage of visitors that scroll down your page. The “hotter” the area, the more people viewed it. In general, the further down the content, the less people will scroll to it.
- Click maps show where users click on the page. The more clicks an area gets, the hotter it will be. As you can imagine, click maps are usually centered on buttons and other calls to action.
- Touch maps are similar to click maps, except for touchscreen devices. Instead of showing clicks, they show where visitors tap their finger(s) on the page.
- Move maps track mouse movements for desktop users. Usually mouse movement is correlated with clicks, so this is very useful data.
Why Use Heatmaps on Your WordPress Site?
Heatmaps are a useful way to get some insightful data about how users interact with your website. They are a useful way to implement design or layout changes based on visitor tracking data.
Let’s cover just a few reasons why you should use heatmaps on your site.
Show Hot Spots on Pages
First and foremost, heatmaps show which pages are “hot spots”, or areas that attract the most attention. This is useful to see which parts of your home page or landing page design attract the most attention and which parts are ignored.
Show Which CTA or Page Elements Are Most Effective
Click and touch maps are very helpful for seeing which calls to action, buttons, and other elements are the most effective in converting users.
This includes getting them to make a purchase, sign up for your newsletter, create an account, and many other types of interaction.
Using a heatmap, you can see which buttons work well and which ones are ignored by visitors. This allows you to fine-tune the text and placement to increase performance.
Track Clicks
Click heatmaps show which elements users click on (and which they don’t). If your page has a large number of links, buttons, or other clickable elements, this type of heatmap is very useful for seeing which ones work best.
If you have a lot of links or buttons that don’t get clicked this data can help you streamline your page and improve the odds that a visitor will click on something.

See How Many People Reach the End of Content
Scroll heatmaps track how many people scroll down to the bottom of your page. This is very helpful if your product requires a long explanation and has calls to action at the bottom of the page.
If not many people do scroll down, it’s likely that your page is either too long or is not designed well enough to maintain their interest.
Using this data, you can redesign your page to convert better.
Help Identify Issues With Navigation or Page Design
Finally, heatmaps can help identify issues with the layout or navigation of your website.
Sometimes users can be confused by menus, page navigation, layouts, or other complicated elements. This is especially true if you use complex layouts or JavaScript actions such as parallax scrolling.
Using heatmap data, you can simplify the layout of your website, make it easier to navigate, and improve its usability. All resulting in higher click rates, email subscriptions, or sales!
How to Add a Heatmap to Your WordPress Website
Now let’s walk through adding a heatmap plugin to your website. For this walkthrough, we’ll use the Hotjar plugin, as it has a free plugin that is full of useful features.
Step 1: Create an Account on Hotjar
First, you’ll need to have a Hotjar account. You can create one by going to Hotjar.com and filling out the form to create your account.

Step 2: Download, Install, and Activate the Plugin
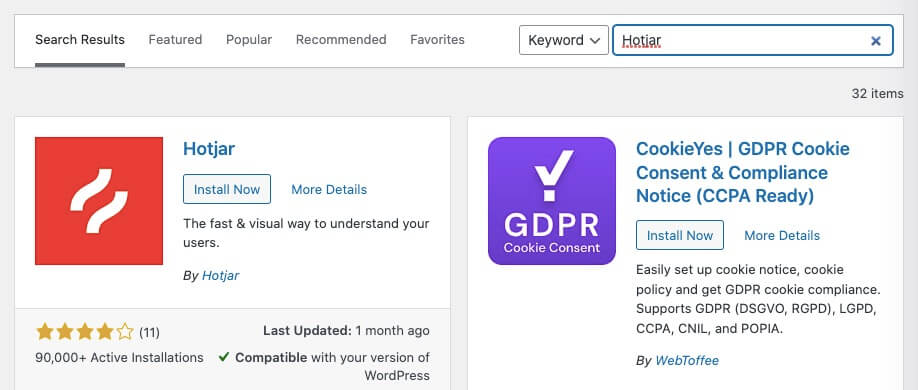
Go to Plugins > Add New on your WordPress sidebar. Then, search for Hotjar. Install and activate the plugin.
Step 3: Connect the Accounts
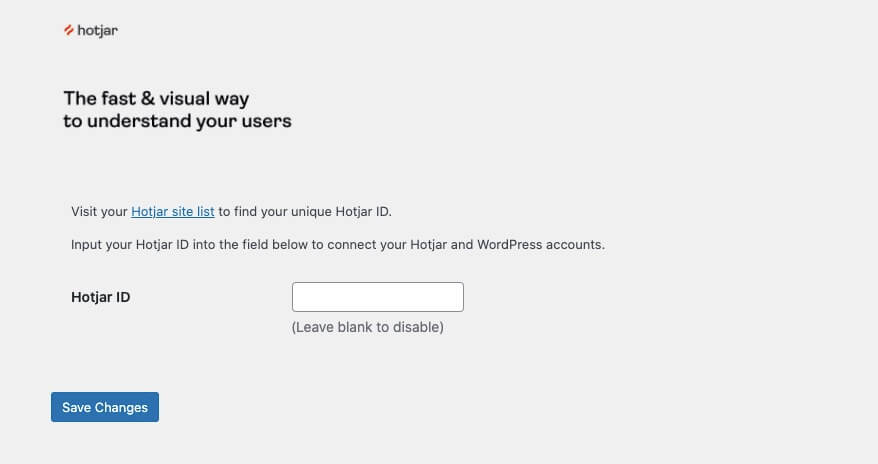
Once you activate the plugin, go to Settings > Hotjar on your WordPress sidebar.
Now you’ll need to fill out a questionnaire and connect your Hotjar account. The questionnaire will ask for a code.
You can get this code by going to Hotjar.com and finding the Sites and Organizations page. Next to your site, you’ll see an ID code.
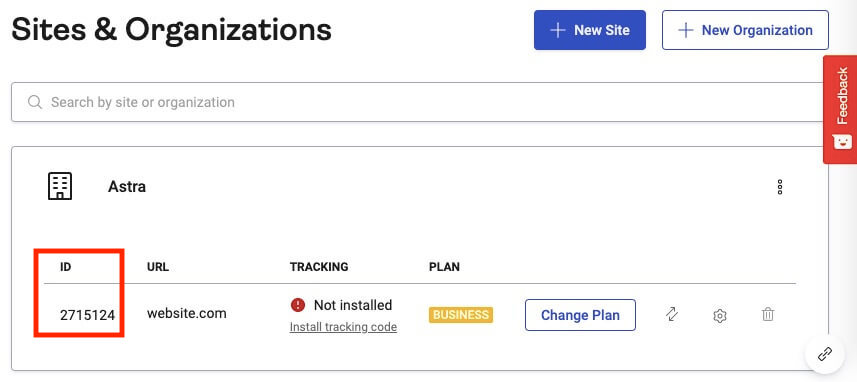
Copy and paste the code into the box on your WordPress site and then press Save Changes.
It will take some time for the data to start coming in. Once it does, log into your Hotjar account.
Under Heatmaps, you’ll see something like the following image below. The areas where users focus are indicated with bright red and yellow colors.
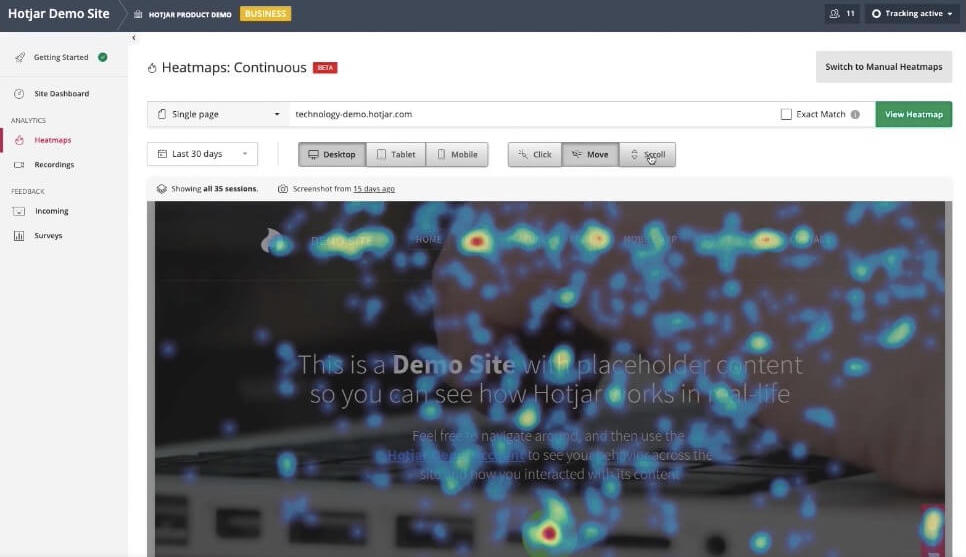
Now we have Hotjar installed. Nice job!
You can change which page is displayed by using the navigation bar at the top. Now you can start using your data to make more changes to your site and improve performance.
How A/B Testing Can Be Useful in Conversion
One of the actionable things you can do with heatmap data is to run A/B tests. These are an excellent way to test different elements on your site and see how they perform with real-world users.
But what’s an A/B test?
The idea is simple. You set up two different versions of a page, display each of them to visitors 50% of the time, and then interpret the results. Using this data, you can determine which changes you should make to maximize revenue and engagement.
For instance, A/B tests are often used to test copy (text) and design elements. Certain phrases or button colors tend to perform better than others, which is reflected in the heat map.
By changing these elements, you can increase your subscriptions and revenue, among other things.
How to Use A/B Testing
When it comes to A/B testing, you can really fall down the rabbit hole with the different options available. However, there are an abundance of simple tools, too.
We recommend using a plugin like Splithero or Nelio A/B testing.
Both offer simple ways to test different elements on your site.
5 Heatmap Plugins You Can Use with WordPress
Now that we know how important heatmaps are, let’s talk about using them!
Thankfully there are many excellent plugins available for WordPress that make it easy to use heatmaps on your site. Let’s cover the five absolute best ones.
Lucky Orange

Lucky Orange is a collection of different conversion optimization tools. They help you reduce cart abandonment, increase sales, and improve performance for a variety of other metrics.
Their heatmap tools include clicks, scrolls, and mouse movement. You can see how far people scrolled down on your page, what they clicked on, and where they moved their mouse.
You can also see visual engagement patterns and see session recordings of how users interacted with your site.
CrazyEgg

This simple plugin allows you to connect CrazyEgg to your WordPress site. Using their service, you can see snapshots, heatmaps, and user recordings to gain insightful data.
There are also options for implementing A/B tests, scrollmaps, and other useful tools. If you are looking for a simple, straightforward plugin to connect to a heatmap service, look into Crazy Egg.
HotJar

Hotjar helps you understand how users interact with your website. This allows you to redesign and prioritize different elements to improve performance and customer satisfaction.
It comes with heatmaps, visitor recordings, conversion funnels, form analysis, surveys, and tons of other tools that you can use. It’s a powerhouse of features that any serious webmaster should look into, both big and small!
Mouseflow
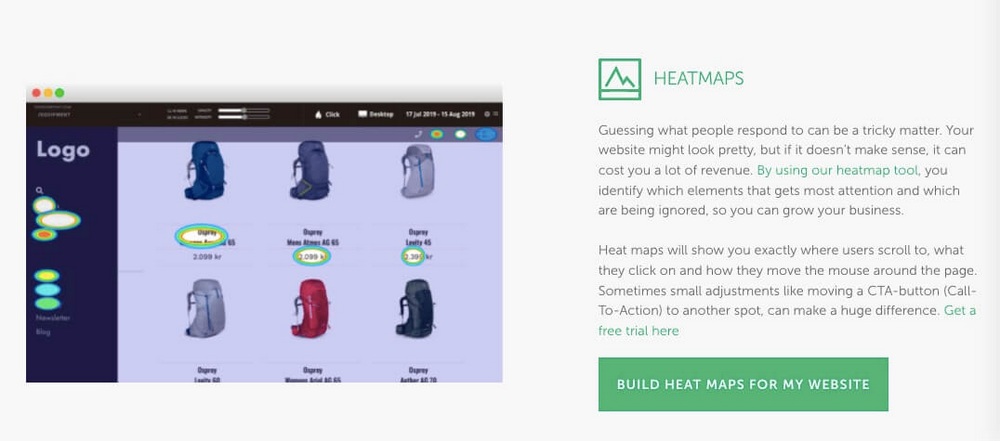
Mouseflow is a powerful suite of tools that helps improve your users’ experience. You can view session replays, use a detailed heatmap tool, create sales funnels, view analytics for forms and other elements, collect and review user feedback, and more.
It’s super easy to connect to WordPress and very straightforward to set up, too. Mouseflow is a good middle of the road option that has both powerful features and ease of use, so definitely check it out if you want that type of program.
Contentsquare

Contentsquare is a powerful analytics cloud tool that helps you understand user behavior and modify your site to take advantage of it. It’s used by huge brands such as Walmart, Adobe, Microsoft, and other well-known companies.
Contentsquare has some advanced features such as AI-enabled insights, accessibility technologies, zone-based heatmaps, customer journey analysis, and more.
If you need a state of the art level heatmaps and analytics, definitely look into Contentsquare.
WordPress Heatmap FAQs
In this last section, we’ll answer some common questions about heatmaps.
How do I add a heatmap to WordPress?
Does Hotjar work with WordPress?
Does Google Analytics have a heat map?
How do you do heat map analysis?
Conclusion
Heatmaps are an often underestimated tool when it comes to website analytics. They can give you some very actionable insights which, if properly implemented, can give you more subscribers, revenue, sales, and other improved performance metrics.
In this post, we delved into heatmaps. First we explained what a heatmap is and what different kinds of heatmaps there are. Then, we walked you through setting up a popular heatmap tool, Hotjar, on your WordPress website.
Finally, we talked about A/B testing and then recommended some other WordPress plugins that you can use to implement heatmaps on your site.
Do you use heatmaps on your WordPress site? Which tool do you use? And what actionable insights have you gained from using it? Share your recommendations and lessons learned in the comments below!
Disclosure: This blog may contain affiliate links. If you make a purchase through one of these links, we may receive a small commission. Read disclosure. Rest assured that we only recommend products that we have personally used and believe will add value to our readers. Thanks for your support!


