What is debugging?
When working with your website, different themes, and plugins, you’ll inevitably encounter some problems. These can sometimes consume hours of your time while trying to find out the root of the problem. This is where debugging can help. You can enable debugging in different ways, and this document will show you how to do it.
Installing a new plugin or theme, updating, or adding a custom code can cause conflicts. Some issues will show immediately and can even make your website temporarily unusable (e.g., the White Screen of Death). Others will show only in certain situations and will create issues with some functionality or plugin. These issues can often be solved by manually deactivating all of your plugins and re-activating them one by one. This way you can find which plugin is creating the issue. Further, you can switch to another theme to check if the issue is coming from that side. All of this takes a lot of time.
If you enable the debug mode, it will display a log of PHP errors and warnings. This can help you find the source of the issue you’re facing quickly.
You could even use this to prevent some issues. Some errors, if they exist, will only be visible in debug log even though everything seems fine on your website.
You can enable debug mode by using a plugin or manually. We will show you how to do it using both methods.
No matter which method you choose, It’s advisable to do this in your staging environment (same as your new installations, updates, etc.) as errors will become visible on both your frontend and dashboard. Thus, doing this on your staging environment will enable you to check errors and fix whatever issues you find without disturbing your visitors.
Method 1 – Enable Debugging using a plugin
If you’re not sure about working with your website files or find Method 2 just too complicated, the WP Debugging plugin is the right solution for you. You can enable debugging using the plugin by following these steps:
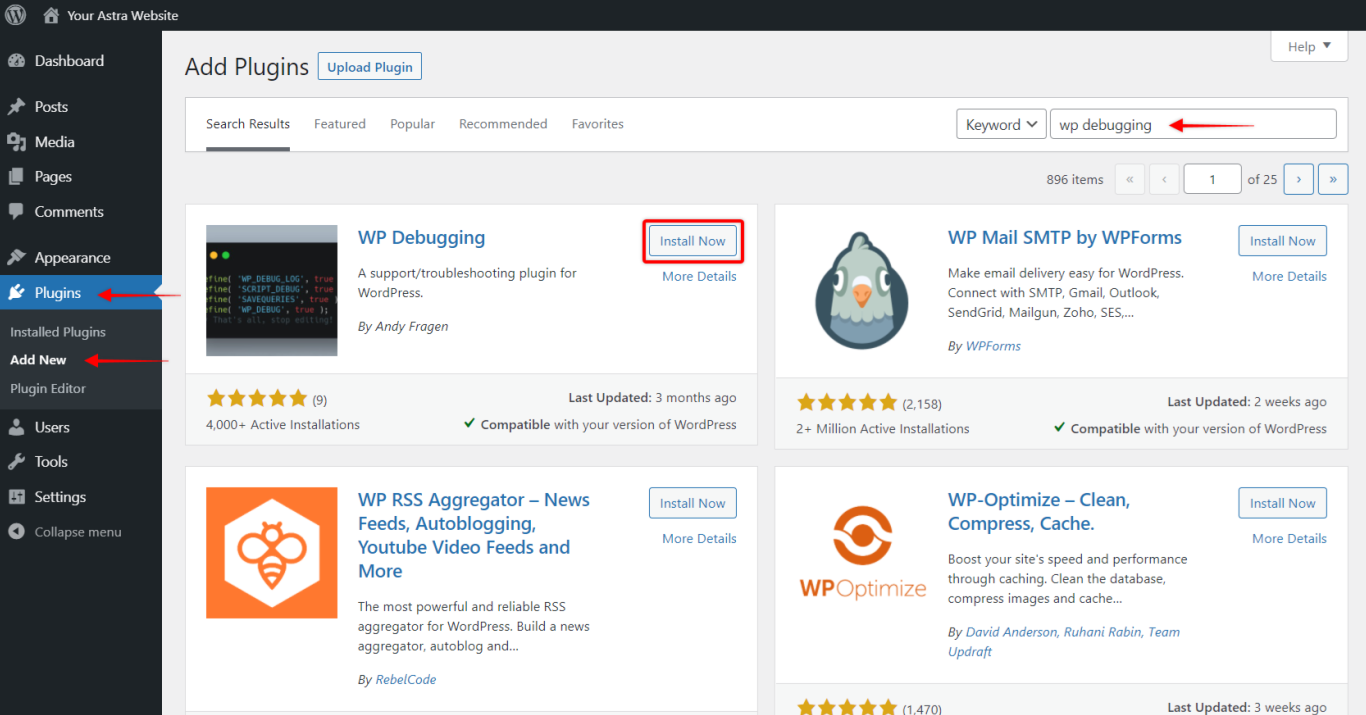
Step 1 – Navigate to Dashboard > Plugins > Add New;
Step 2 – In the search bar, type wp debugging;

Step 3 – Click the “Install” button on the WP Debugging card in the results. Once the plugin is installed, an “Activate” button will appear in the same place;
Step 4 – Click the “Activate” button;
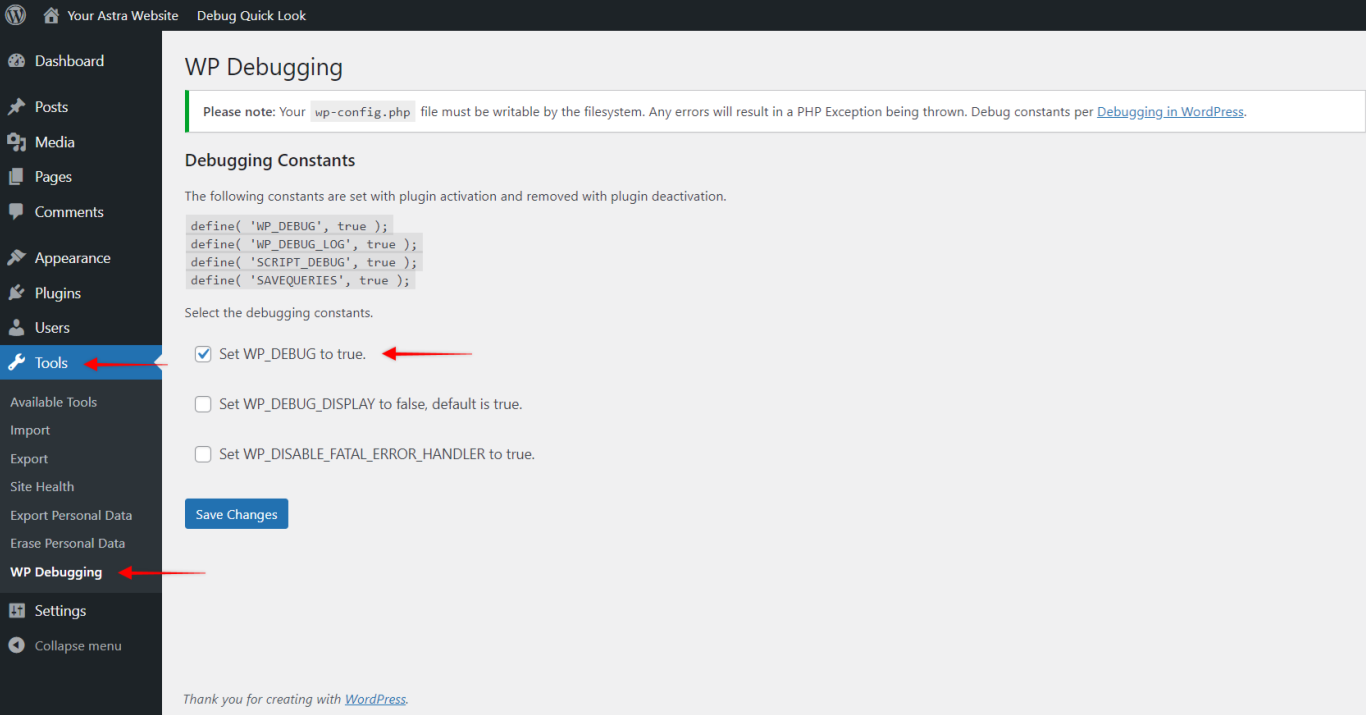
Step 5 – Navigate to the Dashboard > Tools > WP Debugging;
Step 6 – Click on the check box next to the “Set WP_DEBUG to true” option and click on the “Save Changes” button.

Don’t forget to disable the debug mode after you’re done.
Method 2 – Enable Debugging using manually
Alternatively, if you prefer to do this manually and have no problem with editing your website files, or you’re locked out of your website (e.g., White Screen of Death) and don’t have another option, we will show you how this could be done by editing your wp-config.php file.
How to access the wp-config.php file?
Before making any changes to any of your files, please create a complete backup of your website. Also, it is advisable to make a copy of the original file before editing it – in case something goes wrong, you can always use this original file to start over.
For this article, we’ll use the FileZilla FTP client, so please install it on your computer (unless you are familiar with another FTP client you would prefer to use). Let’s start:
Step 1 – Add your FTP access data to FileZillas’ Site Manager
Step 2 – Connect to your server
Step 3 – Navigate to your websites’ public_html (root) folder. Here you should find the found your wp-config.php file.
Step 4 – Right-click on the file and select “Download’ to copy the file to your computer.
Step 5 – Open the file using the code editor to edit the file. You can edit the file using some of the code editors like Sublime Text or Notepad++.
Step 6 – Scroll down to the “That’s all, stop editing! Happy publishing” line
Step 7 – Add the following value before that line and save changes:
define( 'WP_DEBUG', true);
define( 'WP_DEBUG_LOG', true);
Step 8 – Once you modified your file, just upload the file back to your server (using the FTP client), replacing the original file with this modified one.
By following these steps, you will enable your debug mode and create a debug.log file where your errors will be saved.
To disable the debug mode once you’re done, repeat the steps for enabling, just this time, either completely remove the previously added code or modify it as follows:
define( 'WP_DEBUG', false);
How to use debugging?
If you’re trying to debug some issue you’re currently experiencing, you’ll need to repeat the steps that led to this issue once your debug mode is enabled. This will make a new error log, and you’ll be able to check it out.
Viewing the debug log
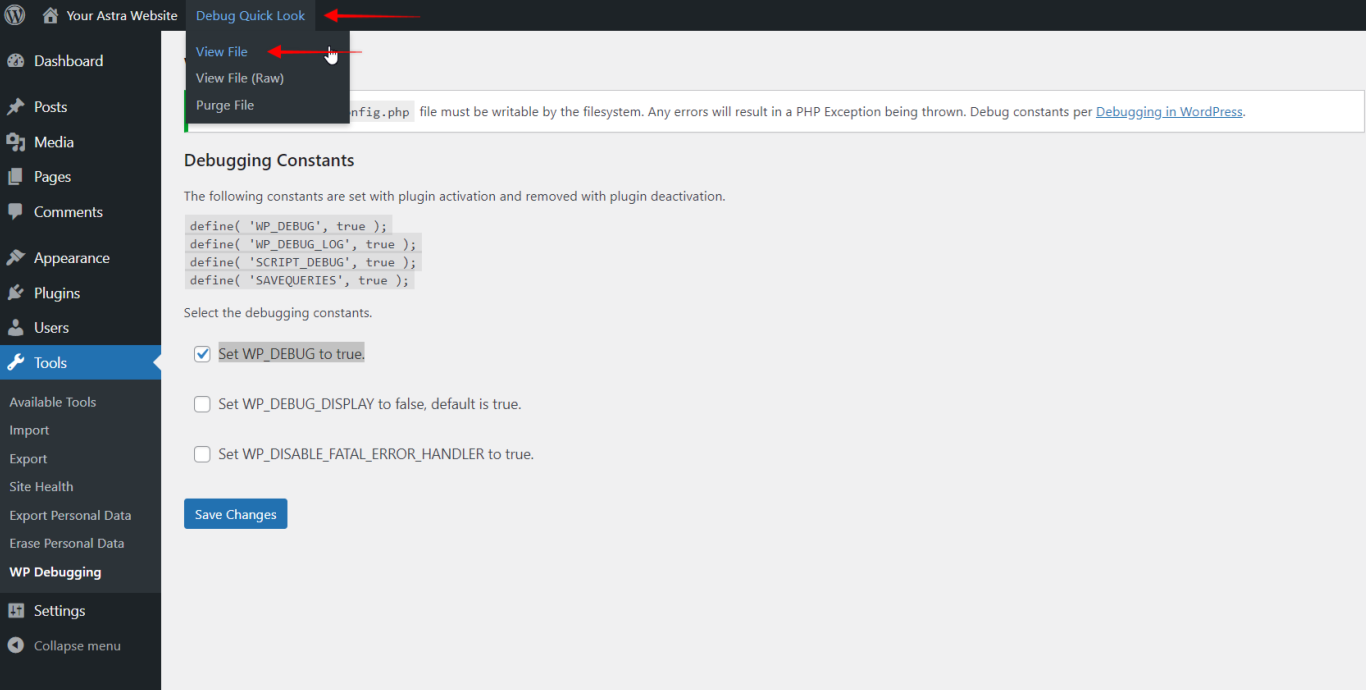
Method 1 – Using the plugin: click on the “Debug Quick Look” menu in your admin bar on the top of your Dashboard screen. In the dropdown menu, click the “View File” option. This will open a new tab showing the errors in the debug log.

Method 2 – Manually: access your site files and navigate to the following path public_html/wp-content/debug.log – open the file to view the errors in the debug log.
